Our Work
Explore how Hanveto transforms complex business data into clear, actionable insights for small retail stores across Japan.
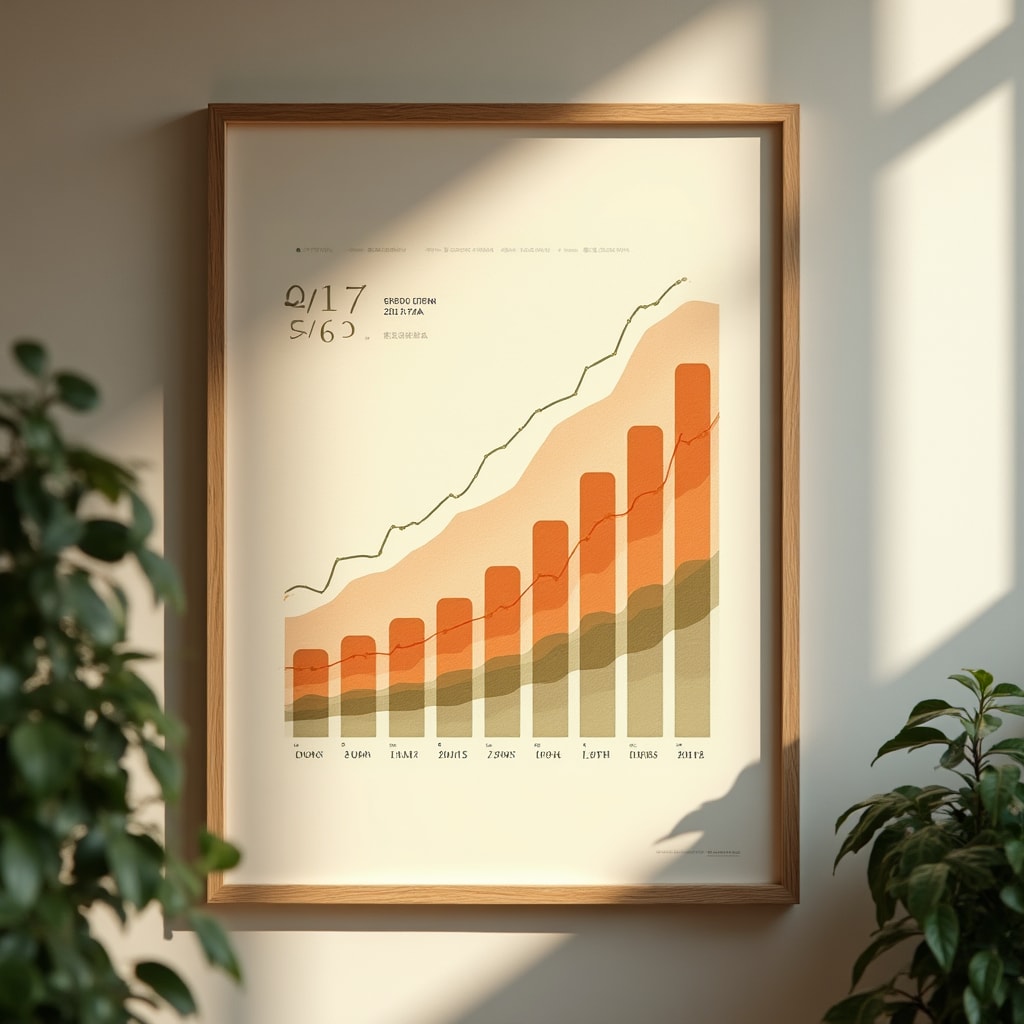
Sales Trend Analysis
Visual representations of sales patterns help store owners identify peak periods, seasonal fluctuations, and product performance trends at a glance.

Customer Flow Mapping
Heatmaps and timeline graphs reveal when customers visit, helping optimize staffing schedules and promotional timing for maximum impact.

Inventory Intelligence
Track which products move quickly and which sit on shelves, enabling data-driven purchasing decisions that reduce waste and improve profitability.
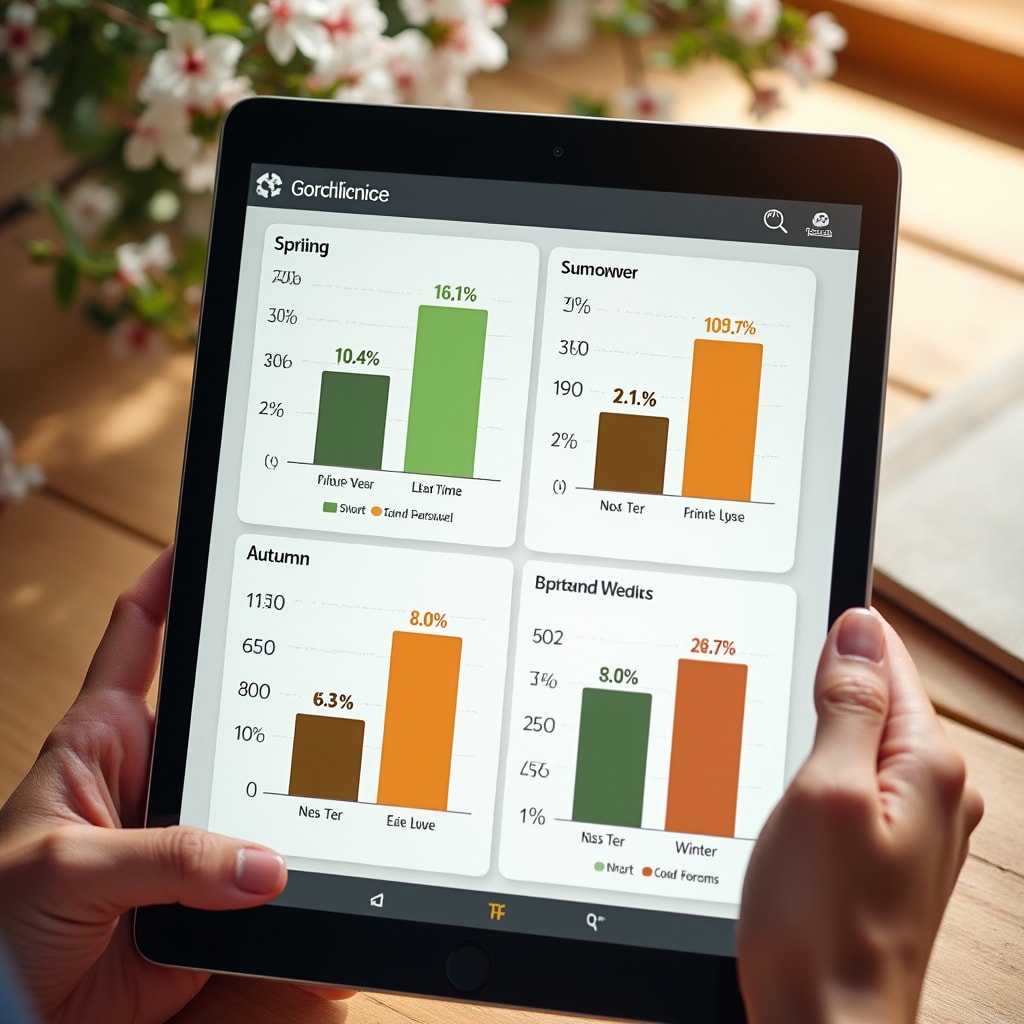
Seasonal Planning
Compare current performance to previous years and identify seasonal patterns that inform inventory planning and promotional strategies.
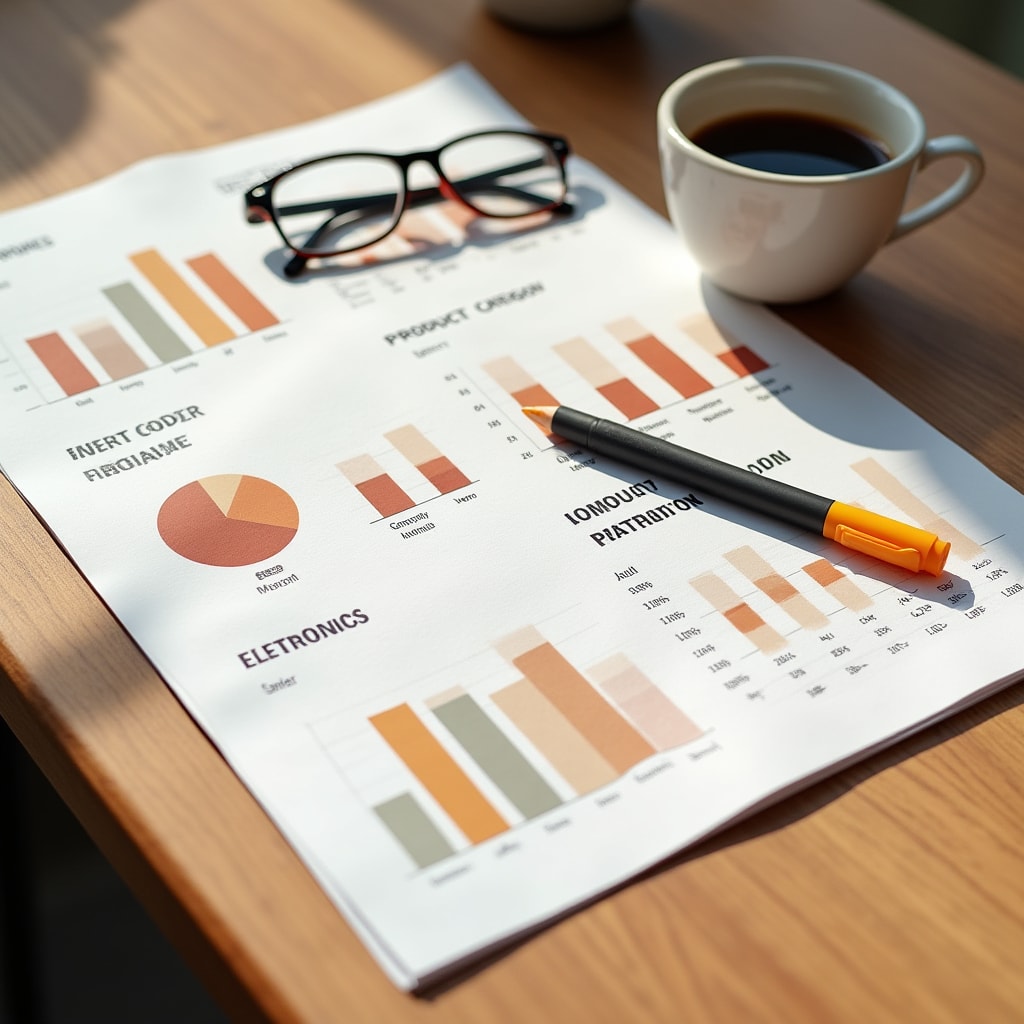
Category Performance
Break down sales by product category to understand which areas of your store generate the most revenue and deserve more shelf space.
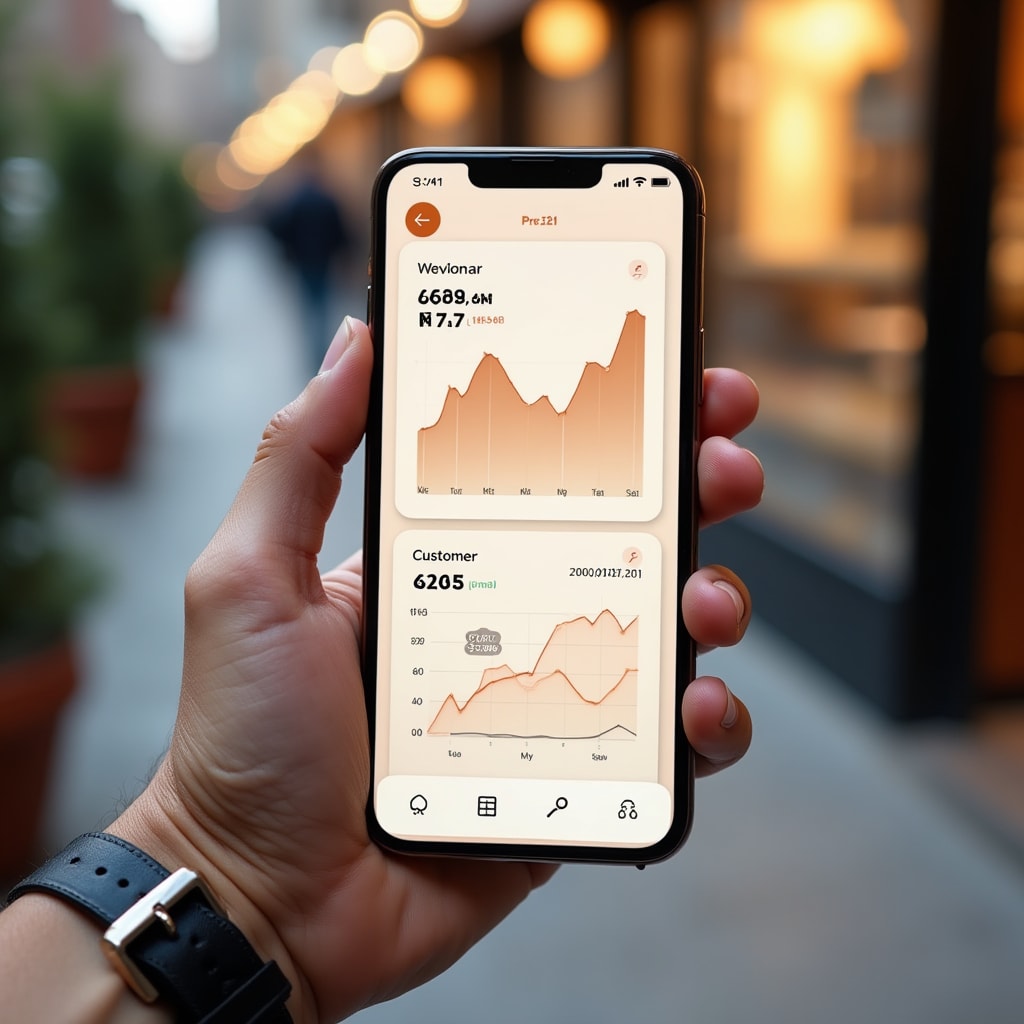
Mobile Accessibility
Access your store's performance data from anywhere using responsive interfaces optimized for smartphones and tablets.
Key Analytics Features
Every feature in Hanveto serves a specific purpose: helping you understand your business and make informed decisions.
Visual Dashboards
Clean, intuitive interfaces present complex data through charts and graphs that anyone can understand without training.
Time Period Comparisons
Compare performance across different time periods to identify trends and measure the impact of changes you've made.
Custom Filtering
Focus on specific products, categories, or time periods to analyze exactly what matters most to your current decisions.
Export Capabilities
Download reports and data for use in accounting, tax preparation, or sharing with business partners and advisors.
Designed for Real Retail Environments
We build Hanveto based on feedback from actual store owners operating in real-world conditions. Every visualization and feature reflects practical needs we've heard directly from the retail community.
The platform adapts to different types of retail businesses, from convenience stores to specialty shops, because we understand that each store has unique characteristics and challenges.
Rather than forcing you to adapt to our system, we design the system to adapt to how you naturally think about your business. The result is analytics that feel intuitive and immediately useful.

Continuous Improvement
We regularly update Hanveto based on user feedback and evolving retail needs. New visualizations, features, and integrations are added to ensure the platform continues serving you effectively.
Your input directly shapes our development priorities. We maintain an open dialogue with store owners to understand what works well and where we can improve.
See Hanveto in Action
Learn more about how Hanveto works or contact us to discuss your specific analytics needs.